引言
这个文章主要总结下,除了加打印,还有什么偷懒的办法来调试内核。
性能调试之前务必先学习USE和TSA方法。
务必多读读Brendan Gregg的博客,可以说他是这个领域的第一人,另外也请多读阿里云杨勇的博客,他系统整理了性能观测的流程。
静态调试
是指不修改应用的源码,只是观察系统的运行状态,来了解当前的问题。
系统负载
通常有问题的时候,系统负载都是高的,一般可以通过top、w、uptime或者cat /proc/loadavg来了解系统的负载和负载趋势。
这个负载表示的是task数/core数,具体可以参考代码:loadaverage.c,
task数包括D状态(uninterruptible)和R状态(running)的task,所以这个负载已经不是单纯cpu的负载了,而是系统的负载,
也可以通过man命令 man proc | sed -n '/loadavg/,/^$/ p' 来了解具体含义。
/proc/loadavg
The first three fields in this file are load average figures giving the number of jobs in the run queue (state R) or waiting for disk I/O (state D) averaged over 1, 5, and 15 minutes.  They are the same as the load
average  numbers  given  by uptime(1) and other programs.  The fourth field consists of two numbers separated by a slash (/).  The first of these is the number of currently runnable kernel scheduling entities (pro‐
cesses, threads).  The value after the slash is the number of kernel scheduling entities that currently exist on the system.  The fifth field is the PID of the process that was most recently created on the system.
关于D状态的故事,可以参考Brendan写的一个小故事Linux Load Averages: Solving the Mystery中的Searching for an ancient Linux patch章节。
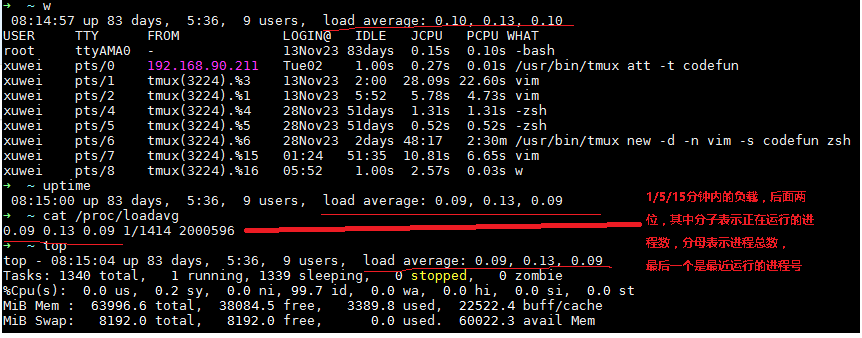
如果1分钟的负载比5或者15分钟高,说明系统负载在增加,否则在减少。如果数值大于cpu数量(cat /proc/cpuinfo),或许系统有问题。
既然R和D都给系统负载做了贡献,分析系统高负载的问题,首先要清楚是R带来的,还是D带来的。
整个debug流程大致如下:
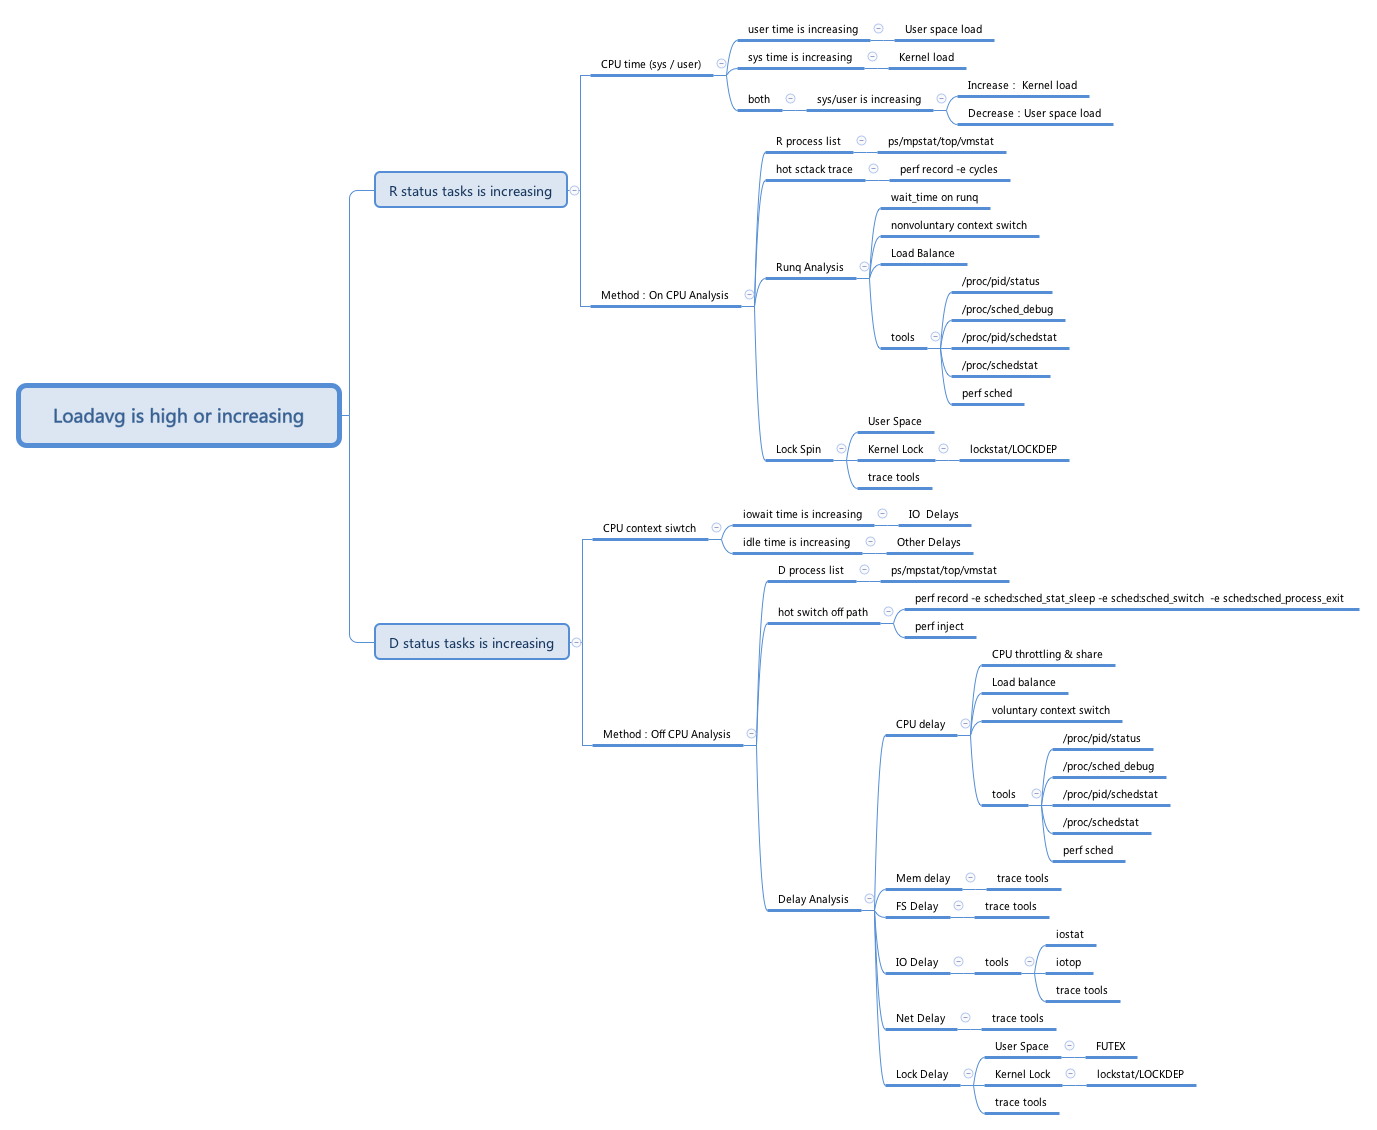
R状态和D状态task变化趋势
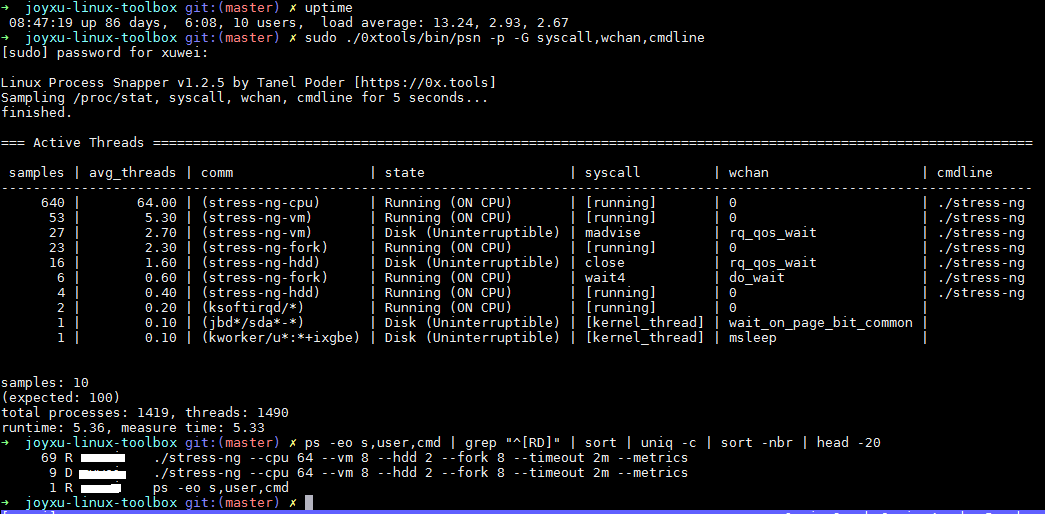
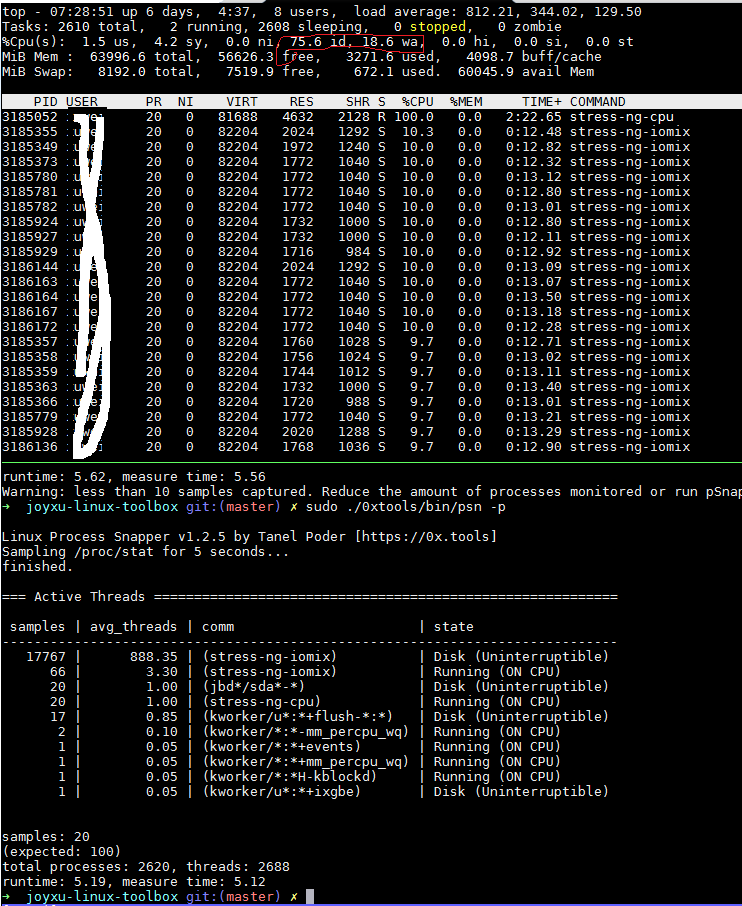
可以通过以下ps命令观察R和D状态的变化
ps -eo s,user,cmd | grep “^[RD]” | sort | uniq -c | sort -nbr | head -20
也可以通过我工具箱里的psn观察
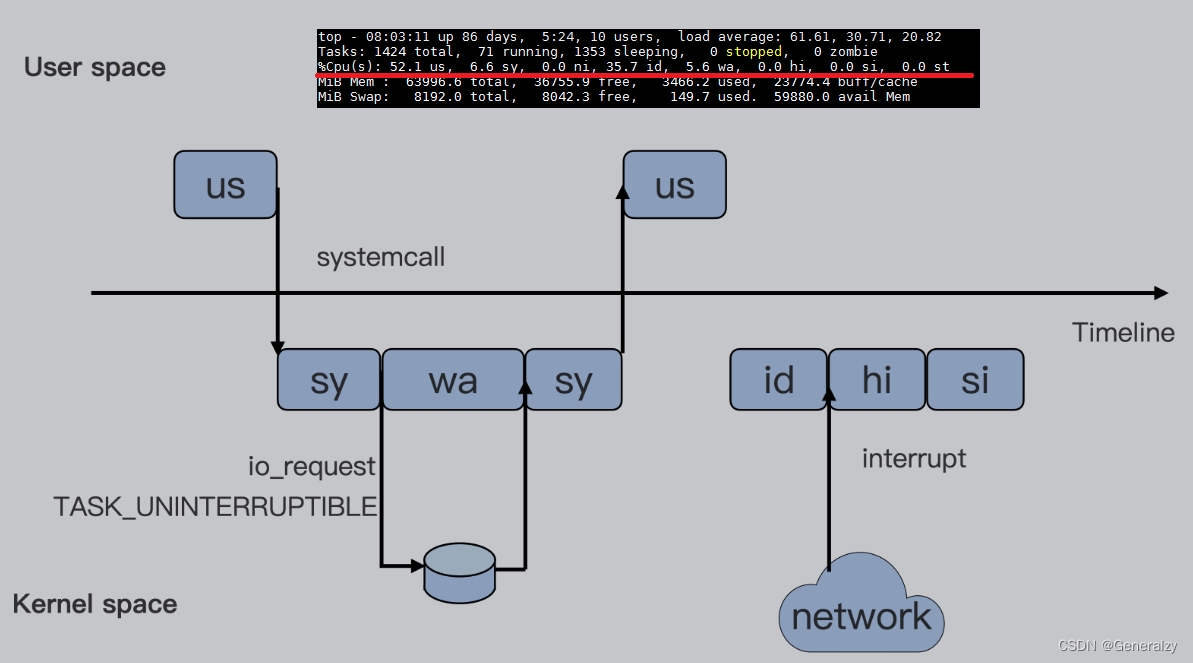
top
之后再通过top命令观测下cpu的执行时间变化趋势,是用户态占比多,还是内核态占比多,还是iowait或者idle占比多。
结合前面R和D的变化趋势,如果发现R的任务占比多,则是通常说的cpu bound,开始进行on cpu分析;
如果D任务占比多,则要进行off cpu分析。
之后可以通过工具箱里的psn,或者通过perf top命令,找到热点应用和函数。
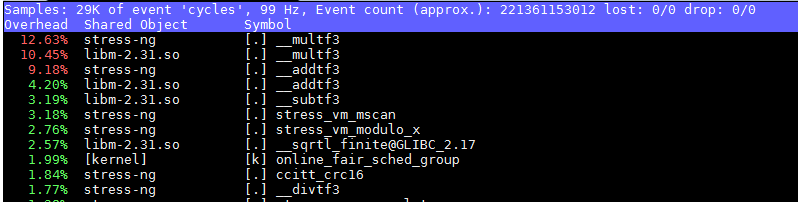
IPC状态
cpu bound的,也可以深入再看看和cpu微架构相关的指标,这时候首先要知道当前cpu的理论IPC值。
理论IPC值
当前并没有工具可以直接获取cpu的理论IPC值,Brendan写了一个通过nop来获取IPC值的文章:The noploop CPU Benchmark
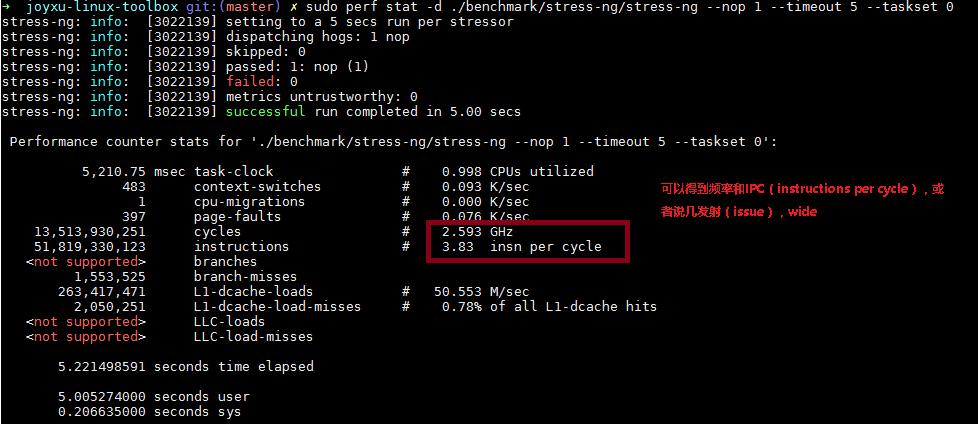
参考这个逻辑,通过工具箱里的stress-ng其实也可以来获取这个值,具体命令如下:
sudo perf stat -d ./benchmark/stress-ng/stress-ng --nop 1 --timeout 5 --taskset 0
结果如下图:
另外,如果是在ARM64平台上,也可以通过sysfs下的pmu的slot文件来判断,具体路径在/sys/devices/armv8_pmuv3/caps/slots,虚拟机上由于还不支持,获取的信息是0,具体如下:
root@localhost:~# cat /sys/devices/armv8_pmuv3/caps/slots
0x00000000
内存观测工具free
A buffer is something that has yet to be “written” to disk.
A cache is something that has been “read” from the disk and stored for later use.
oncpu 分析
perf
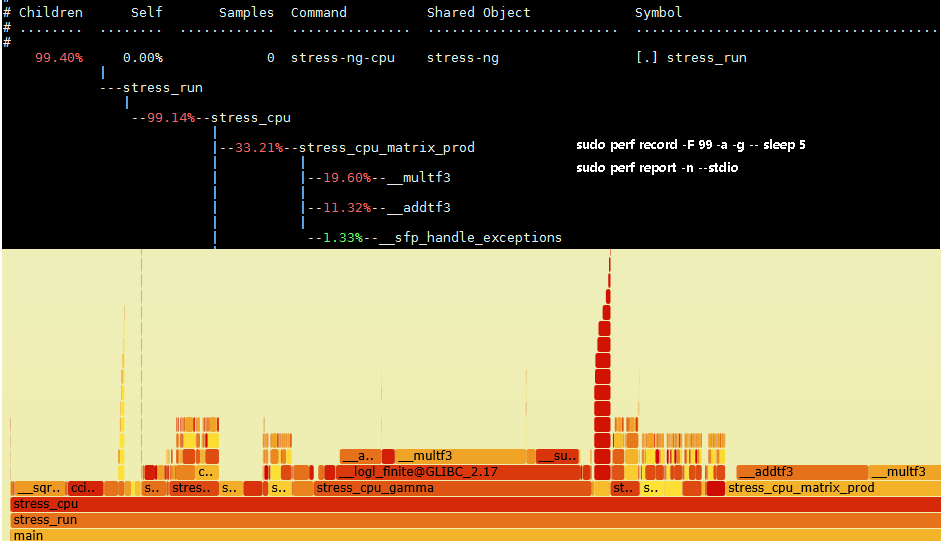
perf是用的最多的,除了直接用perf top看热点以外,通常先抓perf的trace数据,再转换成火焰图。
主要通过以下两个命令:
sudo perf record -F 99 -p 指定进程号 -g -- sleep 30
sudo perf record -F 99 -a -g -- sleep 30  //-a 表示整个系统
perf record 表示采集系统事件, 没有使用 -e 指定采集事件, 则默认采集 cycles(即 CPU clock 周期), -F 99 表示每秒 99次,
-p 指定进程号, 即对哪个进程进行分析, -g 表示记录调用栈, sleep 30 则是持续 30 秒。
之后再用sudo perf report -n --stdio 查看结果,可以统计每个调用栈出现的百分比, 然后从高到低排列。
但是这种不太直观,一般会把record记录下来的perf.data转换成火焰图,可以直接使用下面的命令,其中FlameGraph取自Brendan的仓库
perf script | FlameGraph/stackcollapse-perf.pl | FlameGraph/flamegraph.pl > process.svg
offcpu 分析
offcpu分析务必先看Brendan的Off-CPU Analysis。
cpu iowait高
offcpu分析时,要理解linux kernel怎么计算idle和iowait的,比如下面这个场景
实际上iowait,CPU也是什么都没干的,也是在执行idle线程,只是idle线程里面针对idle和iowait分别计数。
/*
 * Account multiple ticks of idle time.
 * @ticks: number of stolen ticks
 */
void account_idle_ticks(unsigned long ticks)
{

    if (sched_clock_irqtime) {
        irqtime_account_idle_ticks(ticks);
        return;
    }

    account_idle_time(jiffies_to_cputime(ticks));
}


/*
 * Account for idle time.
 * @cputime: the cpu time spent in idle wait
 */
void account_idle_time(cputime_t cputime)
{
    u64 *cpustat = kcpustat_this_cpu->cpustat;
    struct rq *rq = this_rq();

    if (atomic_read(&rq->nr_iowait) > 0)
        cpustat[CPUTIME_IOWAIT] += (__force u64) cputime;
    else
        cpustat[CPUTIME_IDLE] += (__force u64) cputime;
}
而 Linux IO 栈和文件系统的代码则会调用 io_schedule,等待磁盘 IO 的完成。
这时候,对 CPU 时间被记为 iowait 起关键计数的原子变量 rq->nr_iowait 则会在睡眠前被增加。
注意,io_schedule 在被调用前,通常 caller 会先将任务显式地设置成 TASK_UNINTERRUPTIBLE 状态
动态跟踪调试(tracing)
是指通过动态跟踪工具,动态掌握执行的状态,来理解当前的问题。在linux上,tracing的全景图如下:
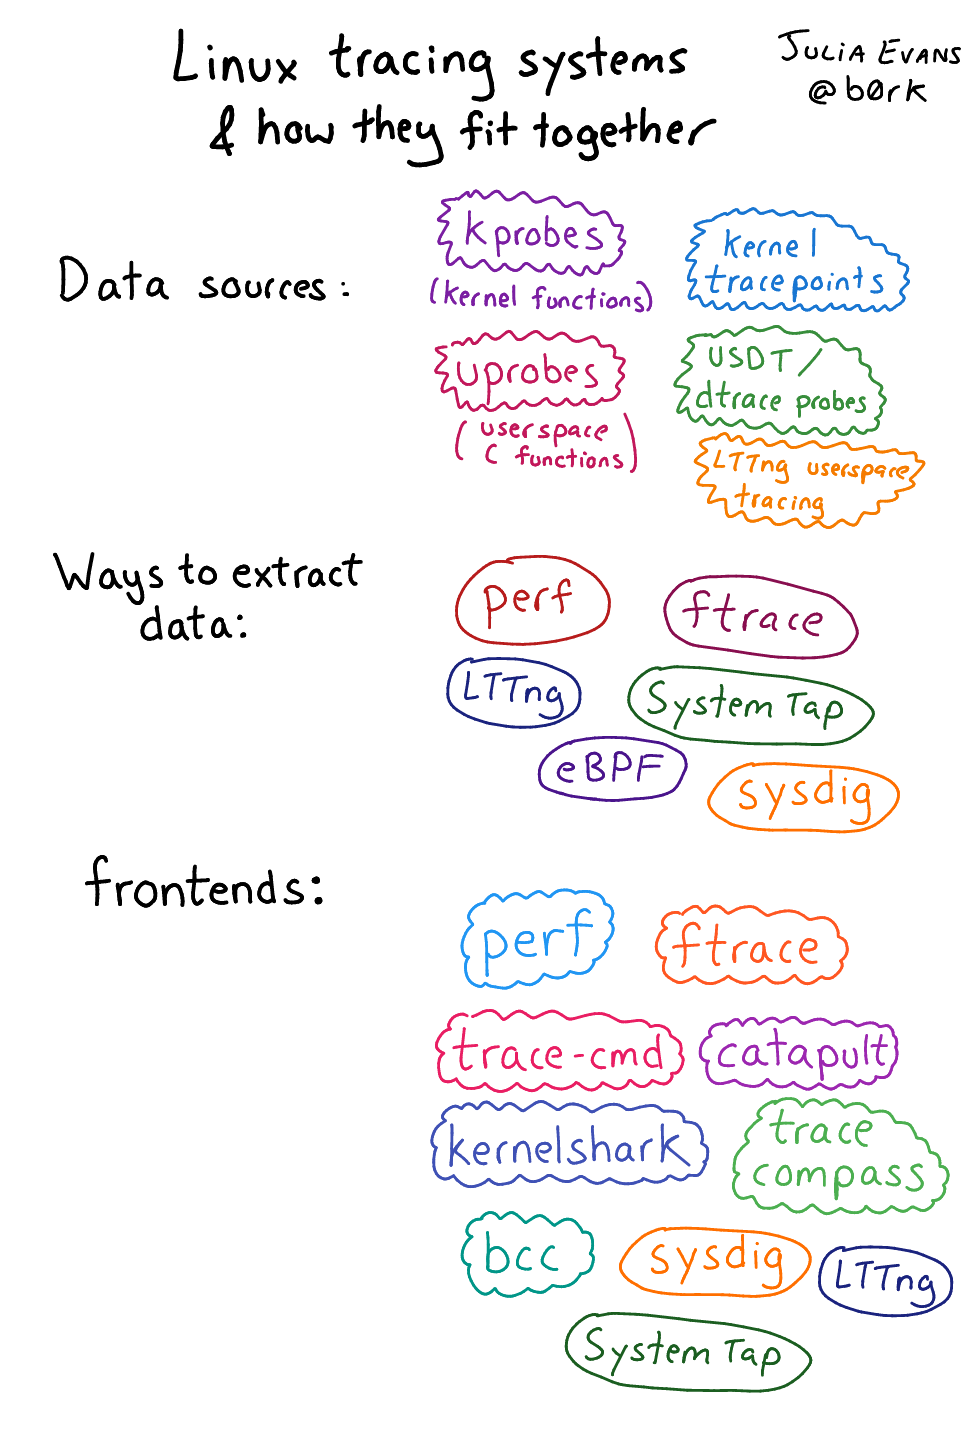
个人推荐的是bpftrace和systemtap。
systemtap
systemtap的历史比较悠久了,
bpftrace
bpftrace是近几年火起来的工具,也有很多脚本可以直接使用了。
参考
- The USE Method
- The TSA Method
- 内核主线讨论为什么要D状态
- Brendan Gregg’s Blog
- Linux Load Averages: Solving the Mystery
- Linux tracing systems & how they fit together
- Full-system dynamic tracing on Linux using eBPF and bpftrace
- 手艺人舍bpftrace而取systemtap的代价和思考
- 第一次使用Linux内核的Tracepoint的体验
- Linux High Loadavg Analysis
- cpu load中所说的不可中断状态到底是啥?
- 容器技术——Cgroup
- Linux 中 D 状态的进程与平均负载
- 进程hang在何处
- Linux Process Snapper
- High System Load with Low CPU Utilization on Linux?
- 运行状态的进程和线程
- free 查詢可用內存
- perf zine
- perf cheat sheet
- Linux Perf Tools Tips
- The PMCs of EC2: Measuring IPC
- Off-CPU Analysis
- 用 perf 生成火焰图
- perf和火焰图使用方法
- Load average, process states on Linux, and some loadavg myths